31
Jul 12

Responder Maps: Week 7

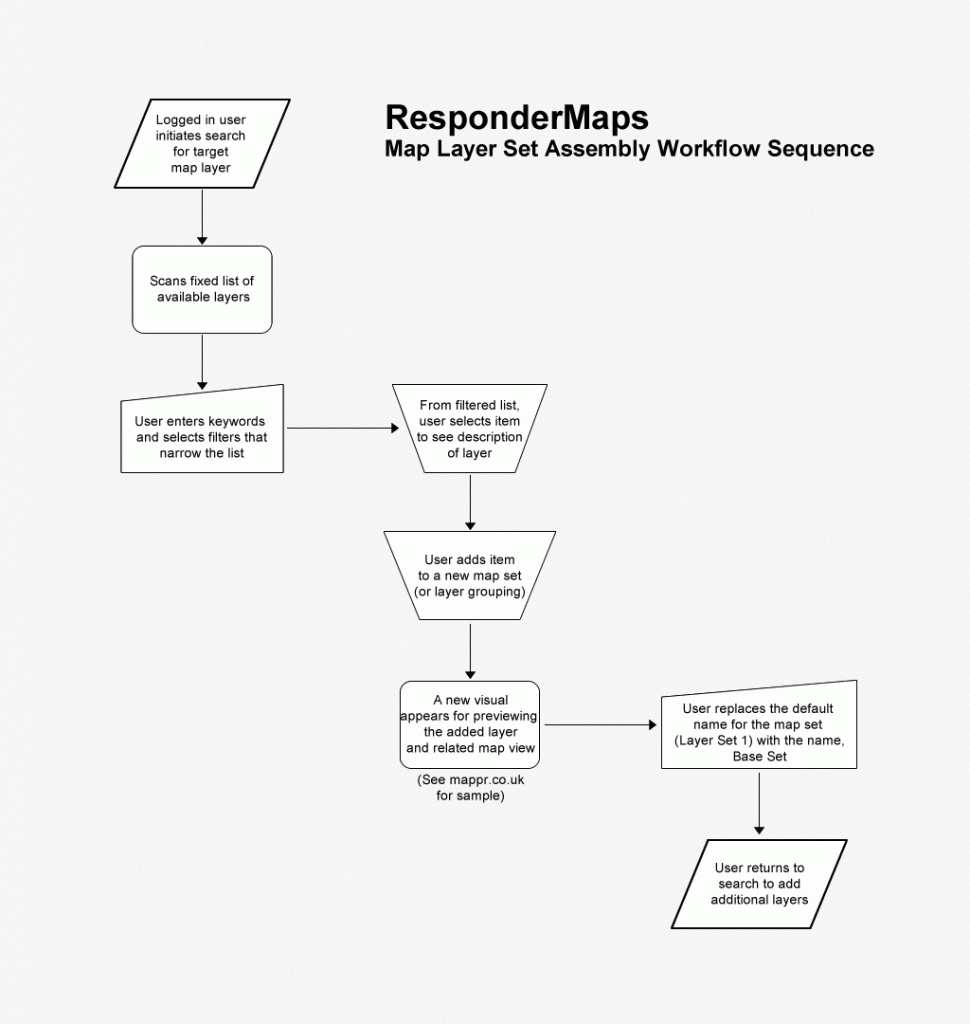
The diagram above illustrates the proposed workflow for a map assembly tool. Employed in fire fighting, the tool enables users to create a common operating picture by assembling incident-related map data.  

Enhanced by Zemanta

04
Jul 12

Responder Maps: Week 6

Accomplishments

In preparation for more formal user interviews, I’ve restructured the context scenario depicted in the Responder Maps demo video to reference established workflow sequences involving the pre-plan site inspection, alarm call dispatching, and situation awareness in the field. By examining the context, needs, goals, artifacts, and transitions of each, I hope to elicit input that will inform future iterations of the product.

A recent presentation to the Geocam group by Mark Micire (NASA IRG/CMU Robotics, FEMA California Urban Search and Rescue) reinforced design thinking integral to problem solving in emergency response. Key takeaways included:

A. Empathize / Define
• Understand the customer by becoming the customer (a variation on “eat your own dog food”).
• Workflow is everything. Start with what exists. If you come up with solutions that don’t integrate well into existing workflows, they will take longer to adopt (if ever).
• Emphasize learnability (different from usability). Lower the learning curve — end users are not rocket scientists nor necessarily technically-inclined. In the field, where training and instinct take over, certain solutions can be more difficult to use, e.g., one that requires sovereign posture.
• Don’t assume internet connectivity or reach back. For complete survivability, consider what happens when systems go down (if app no longer available, articulate why persistent functionality not important to your tradespace.)

B. Ideate / Prototype / Test
• Involve users in ideation — let them scribble, mold, sculpt, etc.
• Find the right person to talk to. Many have introduced/built their own solutions.
• Look to the center of the bell curve for validation (not just the early adopters).
• Design for your parents, not your peers. Many firefighters come from a generation ahead of you, possibly two. (Avoid UI patterns from videogames.)

Additional comments pointed out the importance of understanding the firefighting culture and how best to fit in, useful pointers to heed as one conducts contextual inquiry.

Challenges

In light of the foregoing, getting the most out of the stakeholders we’ve engaged thus far will require soft skills to encourage dialog, ideate solutions, and manage change (as important as hard skills in design or workflow analysis.) Observations drawn in the Design of Everyday Things by Donald Norman seem particularly relevant (sharing research on higher productivity gains from the building design of the FAA’s Seattle offices, where users were heavily involved in the design process.)

Goals

Polish the context scenario/demo video storyboards for further contextual inquiry involving key stakeholder/end user input and activities.

Enhanced by Zemanta

01
Jul 12

Responder Maps: Week 5

Accomplished

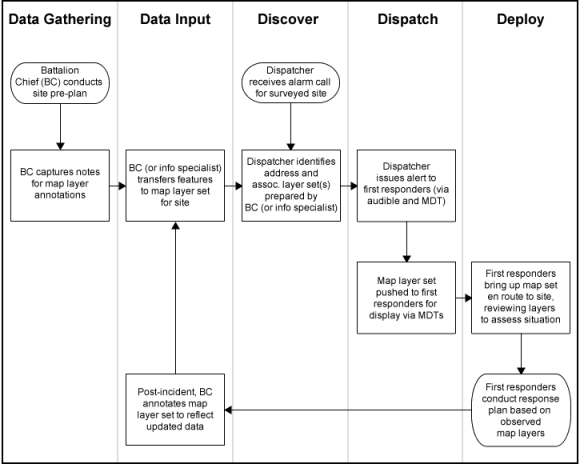
Continued inquiry into firefighter-centric taskflows brought to light complexities involving additional end users, artifacts, transitions, and sequences relevant to the use of digital maps. As currently constituted, the updated scenario begins with an officer (such as a battalion chief, lieutenant, or captain) completing an inspection of a building calling out various features. Upon completion, site-specific details are submitted to a dispatch center for inclusion in a central repository. Reviewed and vetted by officers upon submission, these site-specific annotations become part of the dispatches shared with responders when an alarm call is triggered. Assembling, maintaining, and distributing these annotations touches on various task sequences and stakeholders that vary from one fire department to the next. Even more complexities arise as fire departments formalize these processes to tackle disaster planning at a larger scale, say at a manufacturing facility or chemical plant.

Challenges

The swimlane diagram pictured above posits various steps and transitions mapped to different stages/end users of a digital mapping tool like Responder Maps. Worth noting are the potential roles of specialists trained in mapping technology and dispatchers capable of manipulating visual and geodata from various sources. Many of these skills/roles involve new mapping technologies largely absent or still evolving in most organizations, resulting in a high degree of variety from one organization to the next in task and personnel assignments. Capturing and communicating a scenario that is both universal and authentic in its depiction of data-centric activities thus remains a central challenge.

Goals

One of the goals Responder Maps hopes to achieve with potential pilot partners involves convincing them of the usability of the product absent prior training in mapping technology (typical for many fire departments). By emphasizing features and elements in common with map viewing and editing tools like Google Maps and Google Earth, the resulting demo video will ideally leave the viewer with multiple ideas: that Responder Maps does not require heavy investments in training to be used effectively and can be deployed selectively and flexibly with different users to address different data-related needs.

Enhanced by Zemanta

18
Jun 12

Responder Maps: Week 4

Accomplished

We continue to iterate the script/storyboards for the Responder Maps video. These activities are moving in parallel with requirements analysis. Based on the personas and context scenarios previously mentioned, the focus of the video is shaping up around mapset assembly, sharing, and consumption in the field. I’ve also added some key contacts to my rolodex, firefighters/incident managers from the Menlo Fire District and the Palo Alto Fire Department, that we’ll approach for more detailed feedback on workflows and protocol involving maps and devices in the field.

Challenges

At this Monday’s plenary discussion, attendees heard in detail about the challenges facing the adoption of common standards/services targeting the requirements of multiple stakeholders and end users in the disaster management community. Similar to the common operating picture (or BayCOP) initiative, the Common Alerting Protocol (CAP) struggles to deliver on its vision amid a backdrop of cultural, institutional, and technological obstacles. Maintaining the critical path involves focusing on core requirements (timely delivery of a standardized information payload) and refusing to “branch prematurely” (succumb to calls for “mass” personalization early in the design process.)

Following the foregoing presentation by Art Botterell, Trey and I participated in a breakout session of DMI/BayCOP stakeholders where various constituents (representing interests in fire, earthquake, and critical infrastructure/key resources (CK/IR)) tried to reconcile their diverse interests and visions. Keeping the lessons from CAP in mind, we introduced plans underway to complete the Responder Maps video and highlight key functionality in the context of everyday firefighting response activity. The response was supportive, and, predictably, overwhelming as each party offered directions and concepts to incorporate into the scenario(s).

In closing, we emphasized our focus on capturing authentic goals/behavior from the firefighting domain that could inform best practices and structured data applicable to multiple domains (protection of CI/KR, earthquake response, etc.)

Goals

The primary goal for the coming week is still on development of the Responder Maps video and reaching out to first responders for feedback and research. In addition to capturing the fire-fighting focused scenario in the video, we’ll likely use some time in the closing to describe parallel activities by DMI partners and how common efforts are needed to realize the BayCOP vision of integrated information display and delivery. Given the perspective offered by the DMI presentation and discussions, I’m confident the video will go a long way towards aligning stakeholders behind product priorities.

Enhanced by Zemanta

13
Jun 12

Responder Maps: Timetable


13
Jun 12

Responder Maps: Week 3

Accomplished

Efforts to understand stakeholder/user goals and needs continued in Week 3. Documents reviewed included user personas developed for MapMixers.org (an earlier incarnation of Responder Maps.) These personas (and related scenarios) described the backgrounds, goals, and needs of information specialists working with first responders to improve situation awareness, pre- and post-incident planning and analysis, and reporting.

This information helped frame discussions I joined at the DMI plenary (hosted by CMU) where local software entrepreneur/firefighter, Cal Blake, introduced a small but diverse group to FieldApps.net. Attended by active firefighters, community leaders, technologists, and emergency response officials, the plenary discussion touched on various issues relating to Common Operating Picture services including Responder Maps. The specific app demonstrated by Cal displayed features including standpipes, water mains, power lines, and boundaries, all mapped to topology in a specific response area (Stanford’s campus). He also described functionality supporting data annotations and contributions from users. (Later, Cal and another Palo Alto firefighter described to me the binder maps stations keep to record details specific to oft-visited structures.)

Cal acknowledged issues relating to data provenance and validation, providing a useful entry point to discuss Responder Maps. As currently constituted, Responder Maps is positioned to serve as an exchange for map layer data, serving as a “translator,” normalizing and integrating data from numerous sources. Once established, the data layers catalogued/hosted by Responder Maps will be available to power a variety of map viewers and applications (in addition to the map layer mashup viewer hosted at ResponderMaps.org.) (This ecosystem is analogous to another area I’ve explored a bit, data as a service or DaaS.)

Together, these topics, as well as matters relating to data schemas and mapping standards, yielded useful areas of inquiry to raise as outside organizations are engaged to explore data partnerships.

Challenges

As Responder Maps evolves into an enabling service/platform, requirements gathering specific to data provider partners has come into focus (exposed by the growth of numerous map viewers built by organizations and unaffiliated developers and the proliferation of location-based datasets.) Exploring and exposing valuable datasets requires outreach informed by and focused on the goals and needs of end users, e.g., first responders. To facilitate this agenda, I’ve produced a short video treatment demonstrating the use of Responder Maps by firefighters in the field. Once we validate the script with professional contacts and produce the video, we plan to share it with outside parties to spark discussion of the Responder Maps vision and the need for sample data (as well as related functional and business requirements) to iterate and improve the service.

Goals

Finish production of the short demo video (with end user input) to communicate vision and engage partners in requirements gathering, product design, and development. For additional context, note that I have separately posted another blog entry containing artifacts and deliverables sequenced by delivery date. Status updates to the underlying Google Doc will be made on a weekly basis.
Enhanced by Zemanta

05
Jun 12

Responder Maps: Weeks 1-2

Introduction

During weeks 1-2, I focused the bulk of my efforts on gathering resources to research user-centered application development and design. Initial meetings with Mike Prince/Citizen 911 were promising but quickly led me to conclude high up front investments in contextual inquiry and requirements gathering would be necessary to define and validate a viable product, leaving little time to address usability and design issues.

Accomplished

Further exploration ultimately led me to the Responder Maps project, DMI’s recently revived effort to integrate data with mapping services to display a Common Operating Picture crisis map. As constituted, many of the major features (functional requirements) have been researched, built, and/or logged for future iterations. At this stage, more effort is needed to engage and attract stakeholders (including agencies like BART) to explore their unique datasets and any specific functional and nonfunctional business requirements that may accompany them.

Challenges and Plans to Address

Key to this process is the ability to “sell” stakeholders/data providers on the benefits of sharing their data and on the overall user experience of using the RM tools. To accomplish this, we will create collateral we can share with stakeholders remotely or in person, e.g., a demo video introducing the product. These materials will need to meet the quality and fidelity expected by sophisticated users.

Thereafter, we plan to put artifacts including prototypes and a usability study into play to help validate and identify needed improvements to the product. Recruiting participants and identifying features to test/share will require ongoing efforts and investigation.

Goals

To produce the collateral, Trey has connected me with one of his design interns. This week, I will draft a video treatment for review that we can put into production as early as next week. The second challenge will require more ongoing efforts, e.g., attending DMI meetings and arranging followups with specific stakeholders to recruit participants, working with additional team members to develop prototypes, reviewing product requirements and background materials, etc. More on these items later.

Enhanced by Zemanta